Week 4: Analysing encoded music notation
Task 1: Generating a jSymbolic report
Firstly, I worked with jSymbolic to extract some musical features. The first 11 features presented in the table are the ones recommended for this task. The rest of the features related to pitch, rhythm and tempo were selected by me since I found them worthy to include in my analysis. The jSymbolic report can be seen below or downloaded as a CSV here.
| Feature name | Feature value |
|---|---|
| Number of Pitches | 17.0 |
| Number of Pitch Classes | 7.0 |
| Range | 36 |
| Strong Total Centres | 2.0 |
| Mean Pitch | 56.0 |
| Mean Pitch Class | 6.657 |
| Most Common Pitch | 68.0 |
| Most Common Pitch Class | 6.0 |
| Interval Between Most Prevalent Pitches | 2.0 |
| Pitch Variability | 11.52 |
| Most Common Melodic Interval | 2.0 |
| First Pitch | 40.0 |
| First Pitch Class | 4.0 |
| Last Pitch | 71.0 |
| Last Pitch Class | 11.0 |
| Total Number of Notes | 548.0 |
| Initial Tempo | 112.0 |
| Mean Tempo | 112.0 |
| Tempo Variability | 0.0 |
Task 2: Generating a piano roll and a pitch histogram
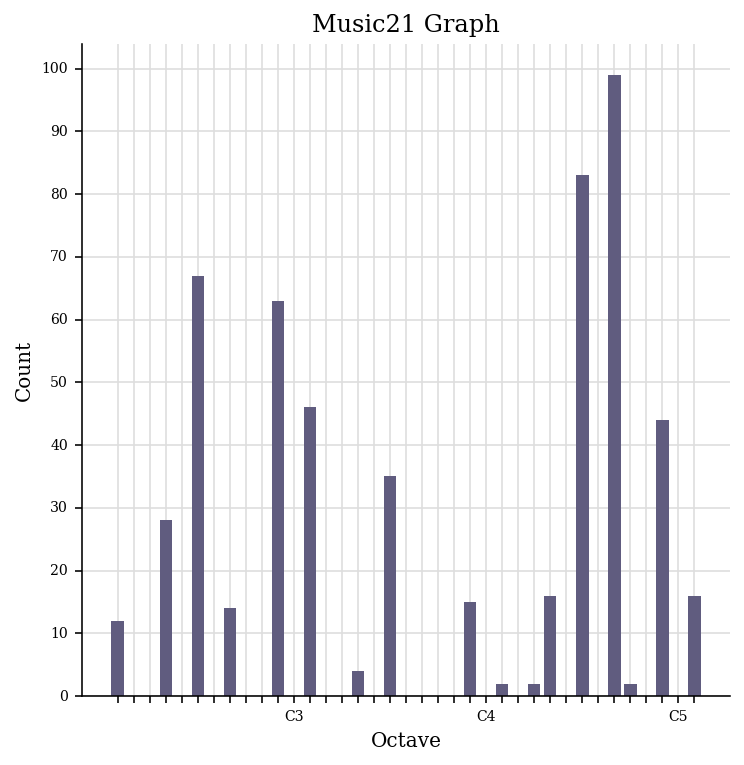
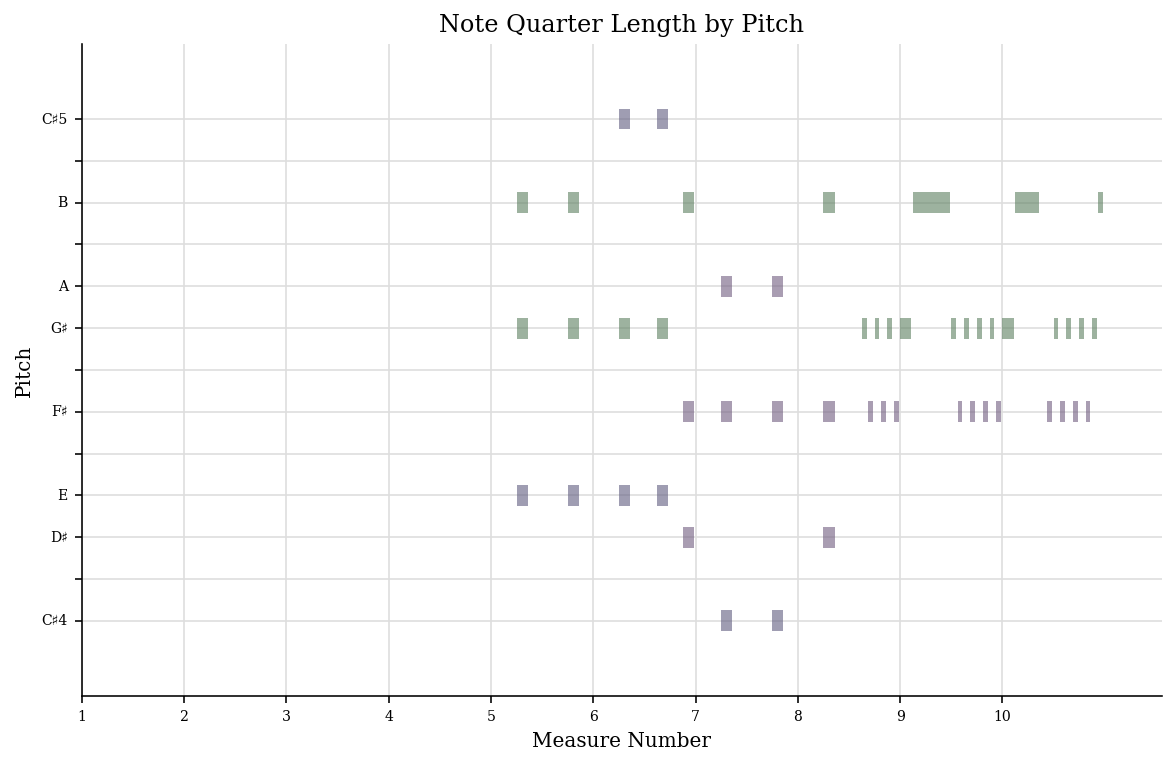
Secondly, I worked with a Python library called music21 to generate two visualisations. The graph on the left (Piano roll) visualises how pitches evolve over time whereas the graph on the right (Pitch histogram) visualises pitch count.
Piano roll
Pitch histogram