Week 8: Acoustic music
Task 1: Identifying audio files and metadata
| Title | Artist | Composer | Copyrights | Genre | Source | File format | Number of channels | Sample rate | Bit rate | Duration |
|---|---|---|---|---|---|---|---|---|---|---|
| Malala | The Inventors | The Inventors | CC BY-NC-SA | Rock (Indie Rock) | Free Music Archive | .mp3 | 2 | 44,1 kHz | 32000 | 03:46 |
| Indust | (029) | (029) | CC BY-NC-SA | Electronic (Techno) | Free Music Archive | .mp3 | 2 | 44,1 kHz | 32000 | 05:34 |
| Air | Yakov Golman | Yakov Golman | CC BY | Classical (Piano) | Free Music Archive | .mp3 | 2 | 44,1 kHz | 32000 | 02:20 |
Task 2: Generating spectrograms and waveforms
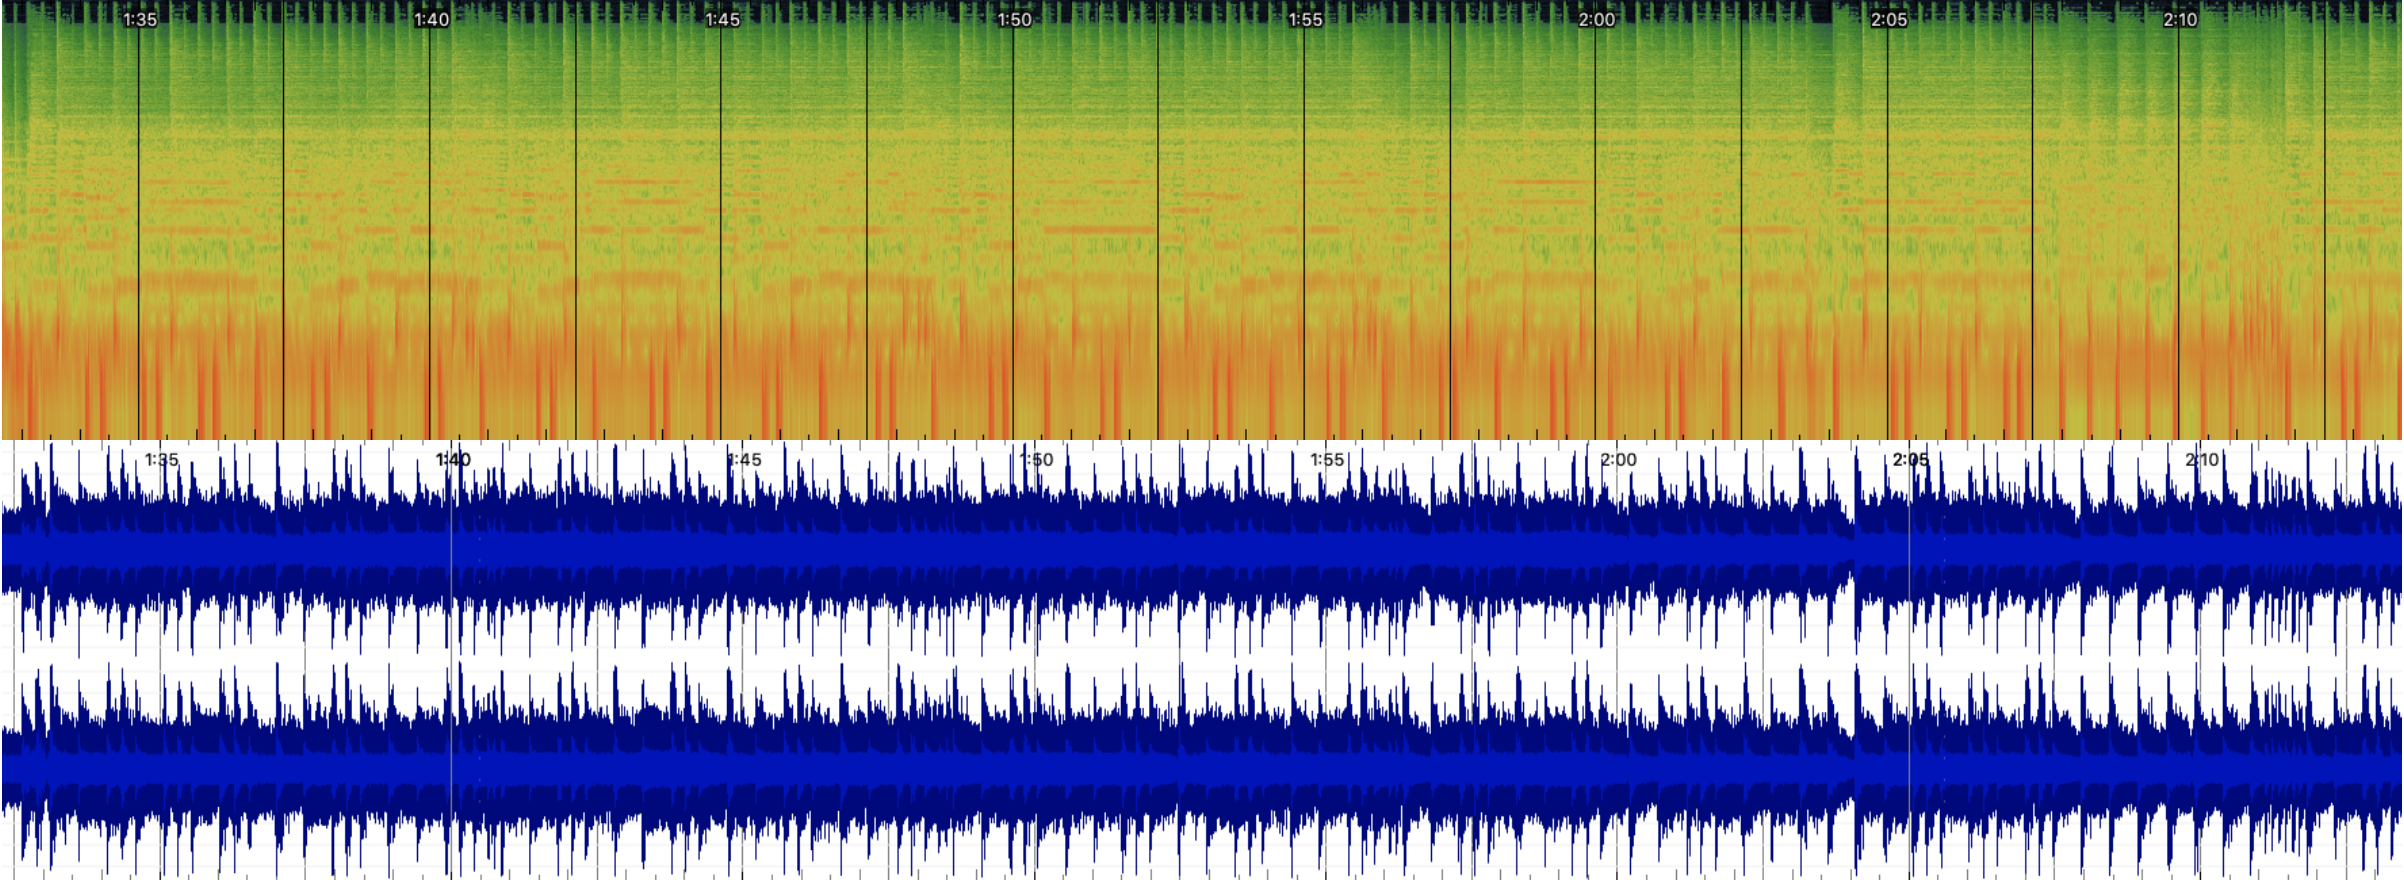
Spectrogram and waveform preview for Malala by The Inventors
See a full-size spectrogram and waveform.
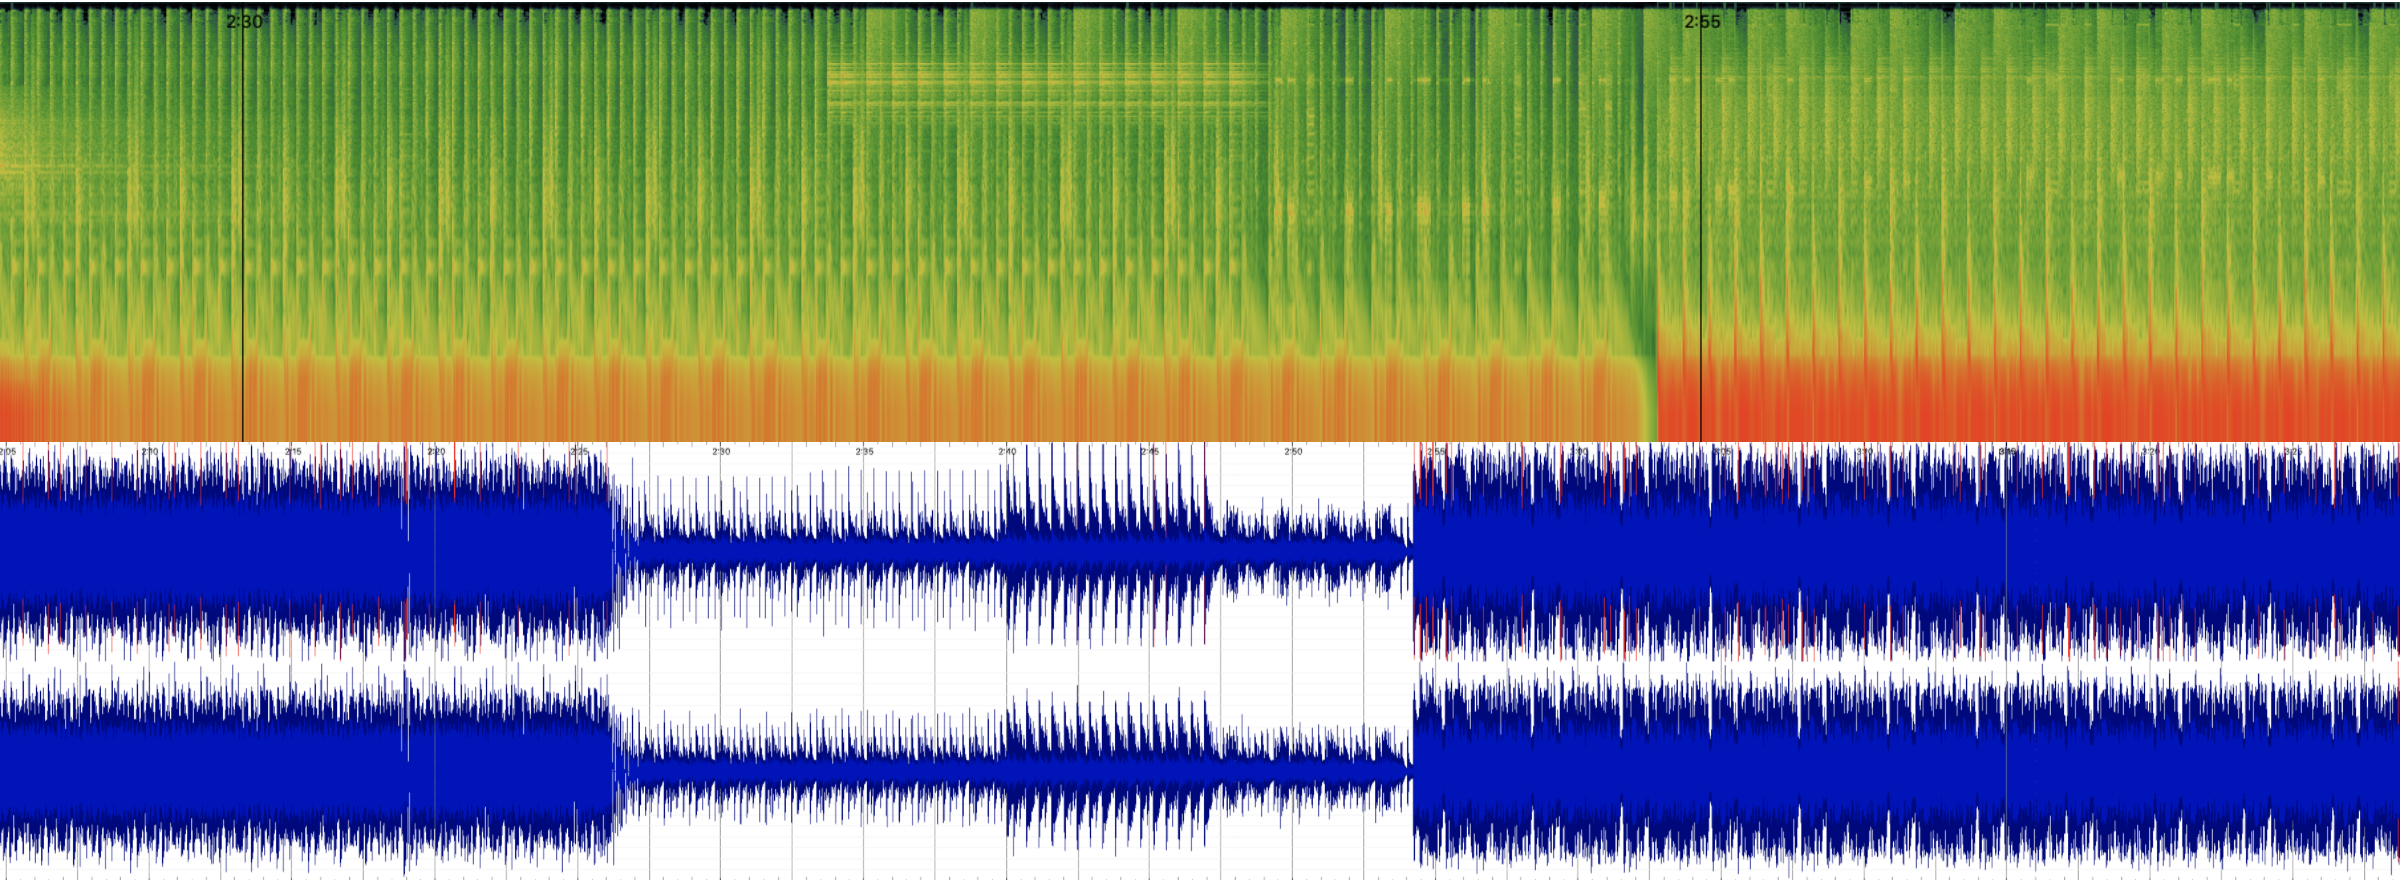
Spectrogram and waveform preview for Indust by (029)
See a full-size spectrogram (the spectrogram for some reason works only as a direct download) and waveform.
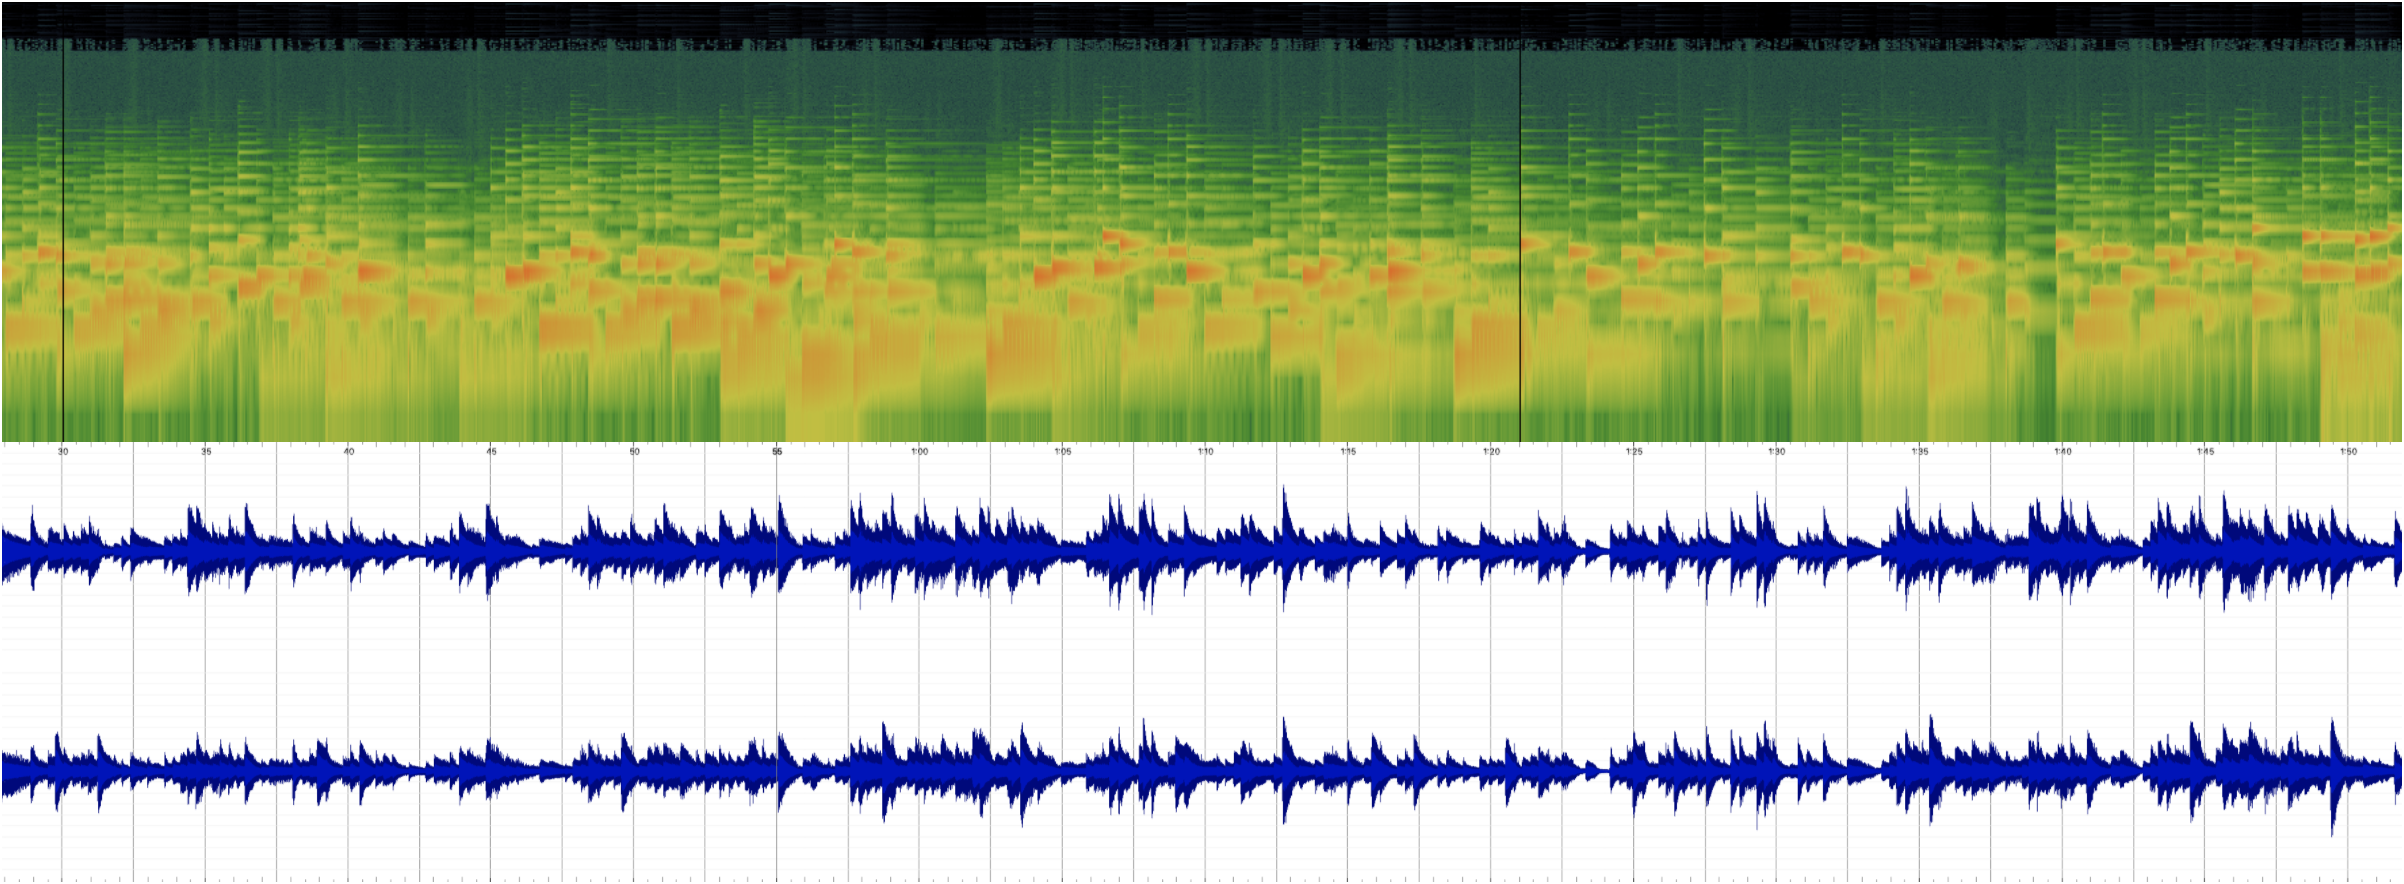
Spectrogram and waveform preview for Air by Yakov Golman
See a full-size spectrogram and waveform.
Describing advantages of a time-frequency analysis over a waveform-based analysis
The representation of sound we get from a waveform-based analysis gives us a clear sense of how loud or quiet a song is at any given point in time. It is easy to detect silences as well as the loudest parts of a song. For example, by looking at the waveform of Indust which is a techno piece, we can clearly see that the song is very loud and energetic for its whole duration without the need to listen to it. Overall, this representation is closer to how humans perceive frequencies. However, there is little information about what frequencies are present but such information can be seen on a spectrogram representation. Since each note in music is associated with a certain frequency, through a close observation, it is also possible to get an idea of which note is being played at any given time. Besides frequency information, spectrograms also visualise amplitude (loudness). For example, if we look at the red-coloured parts on any of spectrograms shown above, we can easily detect the loudest parts of a piece. Conversely, the green parts denote the quiet parts.